Explore Energy Trends in Ireland with New Online Data Portal
In 2018, 90% of Ireland's energy came from fossil fuels such as oil, gas, coal and peat, and just 10% from renewable energy sources.

With the majority of greenhouse gas emissions in Ireland coming from burning fossil fuels for energy, now, more than ever, it is essential that people understand where the energy that we use comes from and how this is changing.
SEAI produces Ireland's official statistics on energy use and to make our data more accessible and user-friendly, we have developed a new Energy Data Portal that will allow people to engage with our energy statistics in a more accessible and interactive way.
What will I find on the Energy Portal?
The portal presents a number of dashboards, which allow you to interact with and tailor charts to explore energy trends in Ireland since 1990. This new online tool allows you to investigate how much fossil fuels and renewable energy sources we use for energy every year; it provides a detailed breakdown by sector and subsector of where we use energy, and you can see how all this has changed over time. The portal is updated regularly and you will soon be able to explore a number of future scenarios of energy use out to 2030.
Some interesting facts you can discover using the portal include:
- The Transport sector used the most energy in Ireland, twice as much as industry
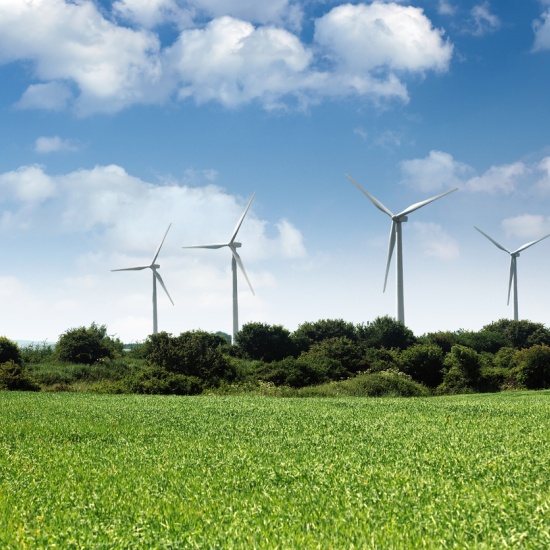
- Wind is the largest source of renewable energy used in Ireland, contributing more than all other forms of renewable energy combined
- Aviation consumes more energy in Ireland than trucks and light goods vehicles combined
- In 1990, coal and peat made up 37% of all energy use in Ireland, but by 2018 this had fallen to just under 10%
Who is the Energy Portal for?
Anyone interested in sustainable energy and climate action will enjoy navigating through our new energy data portal! Our interactive dashboards can be used by anybody from school students, energy professionals, academics, media and government to the general public, who want to explore energy use via interactive charts and download selected data directly to excel.
More charts will be added to the portal to host more of SEAI's energy data on a single, user-friendly platform. This will include energy forecasts, energy related carbon dioxide emissions and sectoral indicators.
Data and Insights at SEAI - Informing National Energy Policy
SEAI's policy advisory role is centred in our Data and Insights team. We have a legal mandate to produce Ireland's National Energy Statistics and produce National Energy Projections annually. Outputs from these functions illustrate progress on energy-related targets, energy related emissions and future pathways for the transformation of Ireland's energy system - with the aim of net-zero emissions by 2050.
In addition to advice provided directly to Government, publications in 2019 included:
Energy in Ireland - 2019 Report Our annual snapshot presenting definitive statistics on energy supply and use in Ireland. The 2019 report illustrated that energy for air travel reached an all time high in 2018; we continue to excel at adding renewable electricity to our grid; and that we still have a lot of work to do to decarbonise heat use in Ireland.
Changing energy behaviour - what works? A review of international evidence on what works for encouraging sustainable energy behaviours. The report recommended several behaviour change interventions, some of which are now being trialled in Ireland to strengthen the evidence base for policymaking informed by behavioural science.
Renewable Energy in Ireland - 2019 Report Our annual update on progress towards renewable energy targets illustrated that we are progressing well with renewable electricity, but lagging behind on renewable heat and transport. This report illustrated that renewables avoided 4.2 million tonnes of CO2 in 2017.