There and Back Again: navigating low-carbon business travel in a post-COVID world
As face-to-face meetings rebound in the years after COVID-19, how can we adapt our business travel to minimise its climate effects?
SEAI, Assemble!
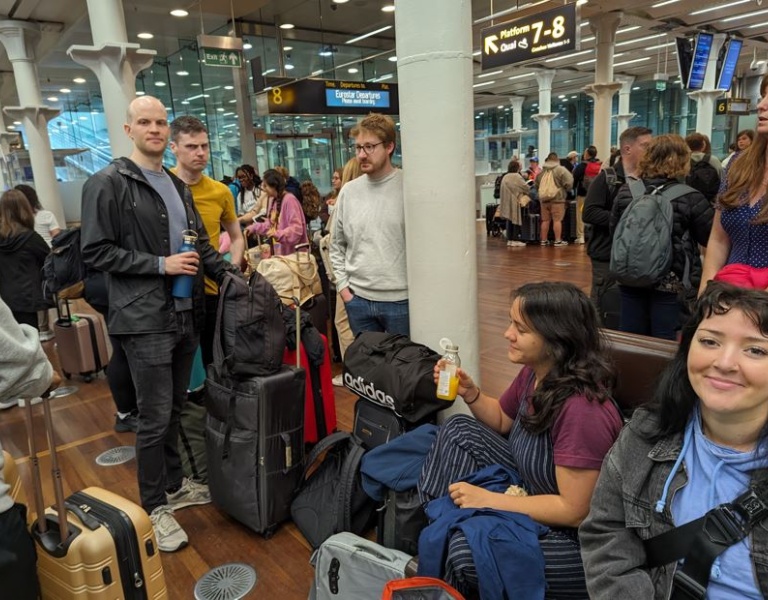
One by one, my colleagues and I found each other at London St. Pancras Station, the morning after an overnight stay half-way along our journey from Dublin to France. There was certainly a sense of adventure, compared to the slog of airport queues and the prolonged confinement of a flight. Not that this was without slogs, but it was novel – we were trying something new; taking the land route to a conference centre outside Laon, where we’d each be presenting at the biennial Summer Study of the European Council for an Energy Efficient Economy (ECEEE).
The Climate Footprint of Work Travel
Like most organisations, SEAI has recognised that the demand for in-person meetings has returned after COVID-19, and as my colleague Fergus Sharkey wrote last year, difficult decisions need to be made about which events to participate in. We need to put a lot of consideration into how to get there without undermining the very energy revolution we’re tasked with bringing about.
Our group trip aimed to chart the experience of surface travel to mainland Europe, a trip usually taken by airplane. We’d make note of the pros and cons, summarise the cost, time, and CO2 emissions compared to flying, and hopefully, minimise the carbon impact of the trip.
This isn’t wholly new territory – Manchán Magan’s been touring Europe by train, while Gemma Tipton’s given us tips on Slow Travel. But how does all this translate to work travel? Does a short meeting justify a long trip? Can business be carried out ‘en route’ ? What are the impacts for family when taking all this time for work travel? We’d gather our experiences and report back.
“Down to Angelsey, on past the Mersey, Birmingham and Coventry are oh so pretty…”
The journey there took a day and a half. The first day of travel was from Dublin to London via Holyhead, butut once I switched to the mainline train at Crewe, things moved quickly.
The train on the eastern mainline was brand new, with comfortable seats and wireless chargers built into the tables to make good use of the 2-hour journey. We stayed overnight at a compact but modern hotel near King’s Cross in London leaving us well rested for the remainder of the journey.
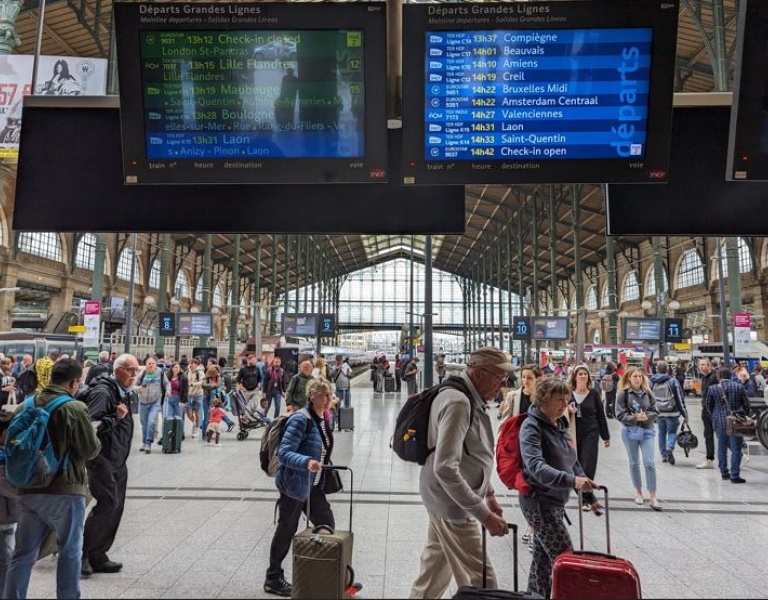
In the morning, we took the Eurostar from London to Paris, which took just 2.5 hours, and again a comfortable environment for work. Compared to airplanes and buses, seating is generally a bit less cramped, and there’s the opportunity to periodically stretch the legs.
The last legs of the journey, in France, were by regional express train (the TER) followed by a chartered conference shuttle bus (there was no scheduled public transport to the conference venue). The 2.5 hours spent on those legs were essentially a write-off work-wise – not really an environment conducive to sitting with a laptop.
Ferries, Trains, and Autobuses
Over the course of our journey, I counted one tram (the Luas), five buses, a ferry, one diesel train, and three electric trains, not to mention various spells of walking or waiting. At both ends of the ferry, foot passengers were escorted between the ship and the terminal by shuttle buses. Part of the Northern Wales rail service was replaced by a coach. An awful lot of getting up, sitting down, consulting my phone’s map, and finding where I needed to be next.
Sure, where would you be going?
The inconvenience of a long journey isn’t only borne by the workplace – I had to make family arrangements as well. A weeklong conference meant traveling on both the Sunday prior and the Saturday after. In the interest of full disclosure, I returned by air because I’d otherwise have missed most of the second weekend and my kids wouldn’t have recognised me!
But this allows me to compare the two options a bit more closely, in terms of the time, money, and carbon footprint (see the Stats Sheet below). There’s a million ways to make the comparison, but I’ve chosen to take the distance travelled in each direction and compare the different costs of covering that distance. A drawback of this approach is that the hotel stay isn’t shown, since it doesn’t cover any distance.
Hurry up and wait
In total, the surface route through the UK took nearly 19 hours, while the return by air took only 10 hours. The hotel stay, which didn’t cover any distance, added a further 9 hours to the outgoing trip. Is this part of the trip’s time cost? Depends on the accounting – sure, I would have been sleeping anyway, right?
Also, one must consider the waiting times. It’s worth mentioning that the longest single waiting time was at Charles de Gaulle Airport (nearly 3 hours), but that the longest total journey waiting time was for the surface route (5.5 hours, compared to 4.25 hours for the air journey) – that’s because of the many changes of travel mode, with a bit of waiting for each one.
How expensive is a piece of string?
The surface route was almost double the cost of flying—€526 compared to €296. But a huge part of this is due to two factors: a Eurostar trip at peak period, and a hotel stay. If there’d been any way to book the Eurostar off-peak, and if the hotel stay was avoidable, then the cost could have been down to €146. While the peak-hour Eurostar was the most expensive long-distance trip leg (at 60c per km), the Sail/Rail ticket – covering the sailing to Holyhead and all the rail connections to get to London – was a relative bargain, at only 12c per km. So, where the sail/rail journey is at a disadvantage on travel time, it’s very competitive on price.
Counting Carbon
Back to the point of it all – the carbon footprint. Air travel has among the highest carbon intensities per kilometre travelled, and it covers the most ground on the return trip. All this adds up to, by far, the largest contribution to global warming of anyelement of the trip, with nearly 100 kg CO2, making the return journey nearly 108 kg CO2.
In contrast, the surface route emitted just over 32 kg CO2 , or just over 44 kg CO2 when including the hotel stay. Either way, this is a massive reduction in carbon emissions for just the outgoing part of a single journey.
Worth mentioning here that there are other modes of travel that emit a lot of carbon – in particular, diesel buses and diesel trains. Their carbon intensities are on the same order of magnitude as an airplane, but because the distances covered were so much shorter, their contributions were significantly less. High speed rail had the best carbon performance and normally covered a lot of ground, but the ferry also performed reasonably well – largely because I didn’t bring a car.
See more detailed time, money and carbon costs in the Stats Sheet below.
| Total Travel Time | Total Cost | Total Carbon Emissions | |
| Surface route (not including hotel) | 19 hours | €354 | 32 kg CO2 |
| Surface route (including hotel) | 28 hours | €527 | 44 kg CO2 |
| Air route | 10 hours | €296 | 108 kg CO2 |
Parting thoughts
Looking back at the trip, I suppose the key question is, ‘would I do it again?’ I’ve learned a few things about what works and what doesn’t, and I will certainly try to travel in the most sustainable way possible going forward. The impact on my family was not ideal,but for midweek meetings, I will always research surface travel for future trips... I’m lucky that in my line of work, it’s possible to conduct business with just a laptop and an internet connection, and I recognise that for many this isn’t possible. I also recognise that it’s not always possible to take the surface route.
I’ll also be assessing the impact of my overall business travel on an annual basis. Many European meetings that used to be in-person have shifted to online-only, and where not, we’ll have to make choices about how many people will attend, if any at all.
What’s the impact of one business trip on my carbon footprint? Not nothing! A recent paper in Nature Energy found that for UK residents, less than 3% of trips were responsible for nearly 70% of their travel emissions. And compared to UK, Ireland has an even more isolated transport network. So, this single change was probably a lot more impactful than my taking my bike to buy groceries instead of driving.
The Fine Print
Meticulous carbon counters may be interested in where I got my emissions factors. It’s important to point out that none of this includes embodied carbon – the initial carbon cost of building the infrastructure and manufacturing the vehicles I used, as it’s much more difficult to find reliable estimates.
But for the carbon factors for the journeys themselves, I used the following:
- UK’s Department for Energy Security and Net Zero, Conversion Factors for Greenhouse Gas Reporting 2023: emissions factors for Tram, Bus, Coach, Ferry foot passenger, and Hotel stay
- Campaign for Better Transport, 2023: emission factor for Diesel and Electric Trains in the UK
- Eurostar: emissions factor for Eurostar Train
- SNCF: emissions factors for TER and TGV Trains in France
- IEA Mobility Model: emissions factor for Air Travel


